How Educators Identify Struggling Students Early
Spotting disengagement early: the attendance, behaviour and attainment signals that matter, the emotional signs that sit alongside them, and how to act before difficulties take hold.

The assumption that struggling pupils make themselves obvious is one of the costliest mistakes a school can make. Disengagement rarely appears overnight: attendance data often shows it building over time, and analysis by the Children's Commissioner for England suggests that for many pupils disengagement begins around the middle of Year 7. Identifying pupils early depends less on instinct alone and more on structured observation, sensible use of data, and a willingness to look beyond marks. This guide sets out research-based ways to organise that work, framed for English schools, and shows where everyday tools fit. Plain-language definitions of the terms used here are in our glossary.
Contents
- Key takeaways
- The ABC indicators, framed for English schools
- Beyond attainment: emotional and physical signs
- Data and analytics in early identification
- Practical techniques for everyday identification
- What the evidence tells us
- How Qwixl:Homework supports early identification
- FAQ
Key takeaways
| Point | Details |
|---|---|
| Attendance, behaviour and attainment together | Tracked together, these three signals predict disengagement more reliably than any single indicator (University of Chicago Consortium; Balfanz and colleagues). |
| Trends matter more than snapshots | A pattern of worsening signs over weeks signals risk more accurately than one missed task or one bad week. |
| Wellbeing is part of the picture | The NHS found about 1 in 5 children and young people had a probable mental disorder in 2023, so emotional signs belong alongside academic data. |
| Ongoing review beats a single screen | The SEND graduated approach (assess, plan, do, review) treats identification as a cycle, not a one-off test. |
| Data and teacher judgement together | The Education Endowment Foundation stresses that identifying need depends on teachers' observation and judgement working alongside data, not data alone. |
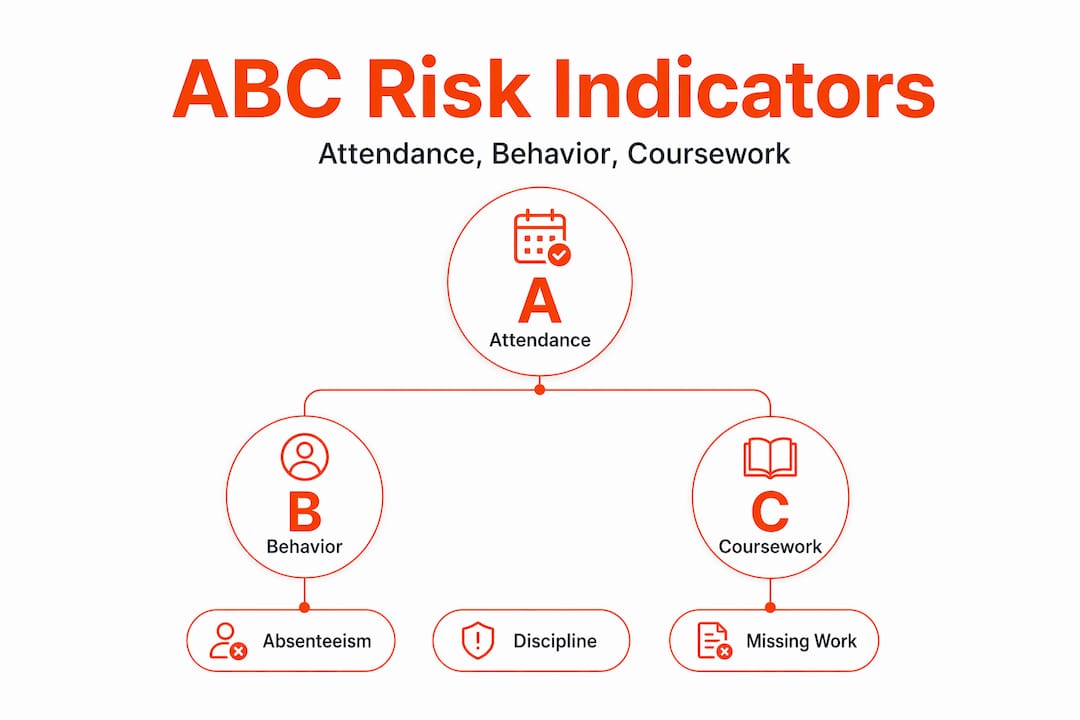
The ABC indicators, framed for English schools
A widely used way to organise early indicators is the so-called ABCs, attendance, behaviour and course performance, which emerged from early-warning research in US schools, including the University of Chicago Consortium on-track work (Allensworth and Easton, 2005) and Balfanz and colleagues (2007). The on-track indicator predicted later outcomes with around 80% accuracy. In an English setting these translate to attendance and punctuality, behaviour, and classwork and attainment, and they are best treated as prompts for professional review rather than as automatic labels.
Attendance is often the first measurable signal. In England, the Department for Education defines persistent absence as missing 10% or more of possible sessions, where each school day counts as two sessions, and severe absence as missing 50% or more. In 2024/25, 18.14% of pupil enrolments were persistently absent. The pattern matters as much as the total: a pupil who misses every Monday, or is persistently late to one lesson, is signalling something worth investigating even if the overall figure looks manageable.
Behaviour indicators include recorded incidents and sanctions, but subtler signals carry equal weight: declining participation, withdrawal from peers, or sudden passivity in a previously engaged pupil. These shifts often precede a fall in attainment by weeks, which makes them among the most time-sensitive cues available.
Classwork and attainment are the most quantifiable. Missing or incomplete work, declining assessment scores and difficulty in core subjects are all meaningful, especially when they cluster with low attendance and behaviour concerns. The table below summarises indicators worth monitoring across the three areas.
| Area | Indicator | Worth a closer look when |
|---|---|---|
| Attendance | Persistent absence | 10% or more of sessions missed (DfE definition) |
| Attendance | Persistent lateness | Repeated lateness to the same lesson or day |
| Behaviour | Recorded incidents | A rising pattern across a term |
| Behaviour | Participation | A measurable drop over consecutive weeks |
| Attainment | Incomplete work | A sustained rise in missing or unfinished tasks |
| Attainment | Trajectory | Declining results across two or more consecutive points |
The key insight from the research is that worsening trends over time carry more predictive weight than isolated data points. A single missed task is noise; three consecutive weeks of declining submissions from a pupil who previously kept up is a pattern that deserves a response. A useful habit is to set a regular review point, for example every three weeks, where staff cross-reference attendance, behaviour notes and completed work for the same pupils. The convergence of two or more indicators across different areas is a far more reliable signal than any single flag.
Beyond attainment: emotional and physical signs
What teachers notice is not limited to the mark book. Emotional and physical signs often precede a fall in attainment and, spotted early, create the chance to act before performance deteriorates. Mental health is a significant factor in how pupils engage: the NHS survey Mental Health of Children and Young People in England, 2023 found that about 1 in 5 children and young people aged 8 to 25 had a probable mental disorder, including 20.3% of 8 to 16 year-olds.

Signs that may warrant an early conversation with pastoral or support staff include:
- Recurring physical complaints such as headaches or stomach aches, particularly when they cluster around school or specific lessons. NHS and YoungMinds guidance notes these can sometimes accompany anxiety in children. They are signals to notice and discuss, not to diagnose, and medical causes should always be considered first.
- Persistent low mood or flat affect lasting two or more weeks, especially with withdrawal from activities or friends previously enjoyed.
- Marked shifts in social behaviour, such as moving from an integrated friendship group to consistent isolation, or a sudden rise in peer conflict.
- Heightened emotional reactivity, such as disproportionate responses to minor setbacks, difficulty with feedback, or visible distress during assessments.
- Changes in self-presentation, including declining personal care, altered sleep reported by families, or notable changes in appetite.
None of these on its own confirms a pupil is struggling academically. Together, they make a meaningful case for involving a counsellor or SENCO to build a fuller picture. The most effective approach pairs these observations with the academic data already collected, so staff respond to the whole pupil rather than a fragment of the record.
Data and analytics in early identification
Data can help, but it is not infallible. Predictive models can reach moderate to good discrimination in some large studies, with reported AUC values around 0.8, though results vary widely with the data, setting and timing. They are best used to prioritise human attention rather than to make decisions automatically. It is also worth noting that the Education Endowment Foundation has found the wider evidence on what actually improves attendance to be weak, so identification should always be tied to thoughtful, well-chosen support.
A poorly calibrated system carries real risks:
- Alert fatigue. Flag too many pupils and staff face false positives that dilute limited support and erode trust in the system. Research on US early-warning systems handles this by tuning thresholds to resources, for example prioritising roughly the highest-risk tenth of pupils.
- Over-identification without matched support can produce labelling effects that harm a pupil's self-perception and engagement, particularly for pupils from historically marginalised groups.
- Under-identification through over-reliance on marks misses pupils whose results look adequate but whose engagement and wellbeing are slipping.
Teacher judgement is therefore non-negotiable. The Education Endowment Foundation stresses that identifying need depends on teachers' observation and experience, working alongside data, not data alone. That matters because quietly compliant pupils can keep up appearances while still struggling, and may not show up in behaviour or attendance figures. Tools that support repeated monitoring across the year, rather than a single annual risk score, fit the graduated approach of assess, plan, do and review set out in the SEND Code of Practice and EEF guidance. Our guide to SEN screening looks at choosing and using such tools well.
Practical techniques for everyday identification
Translating the research into practice takes specific habits.
- Watch for changes in work patterns. Sudden shifts in when and how work is submitted, such as a pupil who always worked early suddenly handing in late or not at all, are among the earliest actionable signals and often appear before results fall.
- Use a structured review checklist. A brief, standard checklist reviewed at set intervals, covering attendance, recent behaviour notes, completed work and any known circumstances, creates a consistent basis for comparison and reduces the chance that quieter pupils are overlooked in favour of more disruptive ones.
- Engage families early. Families often hold context invisible to staff, from changes at home to health or social difficulties. Framing the conversation around understanding how to support the child, rather than around what is going wrong, tends to produce more open and useful responses.
- Build teacher and SENCO collaboration into the calendar. Scheduled review meetings, where teachers bring concerns and support staff bring their own observations, are faster and more consistent than ad hoc referrals. Our overview of evidence-based student support practices and the student support plan checklist set out how to structure this.
- Separate identification from labelling. Identifying a pupil as needing support should trigger a specific, time-bound step, not just a note in their file. Every flag should have an assigned next action and a responsible member of staff.
What the evidence tells us
Two patterns recur across the research and guidance. The first is that most schools do not lack data so much as a culture of treating quiet disengagement as urgently as visible disruption. The pupils who fall furthest behind are often not the ones generating behaviour incidents; they are the ones who stop contributing, submit work that looks finished but lacks depth, and tell every adult they are fine. Indicators like the ABCs catch them, but only when the people reviewing the data look for gradual trend changes rather than threshold events.
The second is that over-identification does real damage when systems are poorly calibrated. When too large a share of a class is flagged, staff stop treating the flags as meaningful. The answer is not less data but better calibration, more deliberate thresholds, and the explicit inclusion of teacher judgement as a co-equal input. What works in practice is a combination of scheduled data reviews, a shared observation culture across teaching and support staff, and support plans built on multiple evidence points rather than a single screening result.
How Qwixl:Homework supports early identification
Knowing the indicators is the first step; tracking them consistently across a whole class or year group is where most identification efforts break down. Qwixl:Homework is built for that gap. It captures assignment-level engagement, including submission patterns and writing signals, to surface the kind of small, early changes that staff rarely have time to track by hand. It provides SEN-informed insight without diagnostic labels, giving teachers and SENCOs an evidence-based basis for early conversations rather than conclusions, and it supports the assess end of the graduated approach while statutory decisions stay with qualified staff. You can read more about how Qwixl:Homework works. For the student-side writing tool that some families use while waiting for support, see Qwixl:Milo.

FAQ
What is the ABC framework for identifying struggling students?
The ABC indicators, attendance, behaviour and course performance, come from US early-warning research (University of Chicago Consortium; Balfanz and colleagues) and are widely used to organise signals of disengagement. In England they map onto attendance and punctuality, behaviour, and classwork and attainment, and are best read as prompts for professional review, not automatic labels.
How often should schools review pupils for signs of struggle?
Identification works best as an ongoing process across the year rather than a single annual check, in line with the SEND graduated approach of assess, plan, do and review.
What proportion of pupils should be flagged as needing a closer look?
There is no fixed figure, but flagging too many pupils causes alert fatigue and dilutes support, while flagging too few misses genuine need. Some systems prioritise roughly the highest-risk tenth of pupils and tune this to the resources available.
Can teacher judgement replace data in identifying struggling learners?
No, but the two work best together. The Education Endowment Foundation stresses that identifying need depends on teachers' observation and judgement alongside data, which helps catch pupils who keep up appearances while struggling.
What emotional signs might indicate a pupil is struggling?
Recurring physical complaints without a medical cause, persistent withdrawal, and heightened reactivity around assessments can all be signs. NHS and YoungMinds guidance notes physical symptoms such as headaches can accompany anxiety, so these are worth noticing and discussing, with medical causes considered first.
Sources and further reading
- DfE, Pupil absence in schools in England, 2024/25
- NHS England, Mental Health of Children and Young People in England, 2023
- Education Endowment Foundation, Special Educational Needs in Mainstream Schools
- Children's Commissioner for England, Why attendance remains my priority
- University of Chicago Consortium, the on-track indicator (Allensworth and Easton, 2005)